



EXPONENTIAL FUNCTIONS
If we want to create a single variable function,  :
 , from exponential expressions, then we must either hold the base
 or the exponent
 constant. If we hold the exponent
 constant and let the base vary, then we have a polynomial function
 . However, if we hold the base
 constant and let the exponent vary, then we have what is called an exponential function to the real number base
 which is defined as follows:
 where the variable
 is any real number and
 .
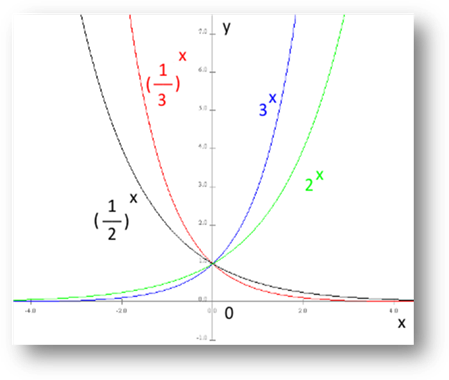
The graphs of the basic exponentials have a special look. For any of the fixed bases  , all of the exponential functions
 have the same domains (all real numbers) and ranges (all strictly positive real numbers). Moreover, all of them have a horizontal asymptote at the
 –axis and a
 –intercept of 1. That is why they are sometimes called a family of functions.
LOGARITHMIC FUNCTIONS
Similarly, we may create a function of a single variable  :
 from logarithmic expressions,
 , provided we hold the real number base
 constant and let the number
 vary. Then we have what is called a logarithmic function to the base
 which is defined as follows:
 where the variable
 is any real number
 and
 . If the base
 , then the logarithm is called the common logarithm whose special notation is simply
 . If the base
 , then the logarithm is called the natural logarithm with its special notation being
 .
The graphs of the basic logarithms also have a strong family resemblance. They all have the same domains (all positive real numbers) and ranges (all real numbers); they all have a vertical asymptote which is the  –axis and an
 –intercept of 1. That is why they too are considered to be a family of functions.
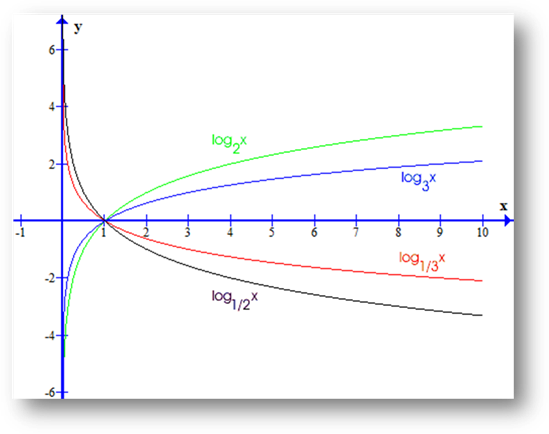
Interestingly, if you look at the above image from the side so that the  –axis is vertical, it looks a lot like the corresponding exponential image only flipped in some way.
LOOKING IN THE MIRROR FROM ONE TO THE OTHER
These two families are actually cousins. In fact, they can be shown to be inverses of one another - both by their definitions (see the tutorials on Logarithms) and by their graphs (see the tutorial Inverses of Functions , pages 7 - 18). Note that each of the exponential and logarithmic functions is one-to-one over its domain and, therefore, invertible.
That visual observation mentioned earlier is, expressed in mathematical terms, an orthogonal reflection over the line  in the plane. This is illustrated, geometrically, in the image below.
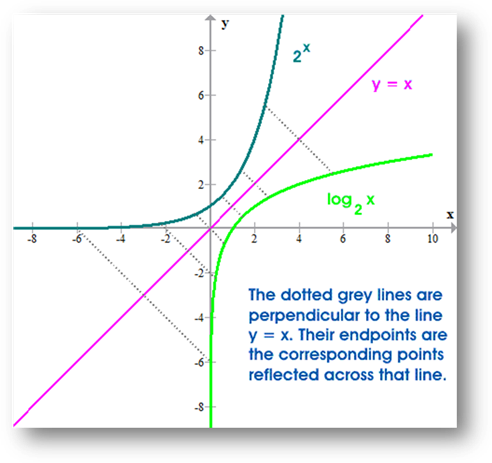
Therefore, the inverse function of  is actually
 (where
 is constant,
 ) and
 is a real variable and, of course, vice versa. Algebraically, we reason as follows:
 composed with

 followed by
 .
The latter equality holds by the definition of a logarithm.
We conclude that  . A similar argument shows that
 .
Last Updated by SAS October 07, 2026, 16:00:34

